PHOTOVOLTAIC 2018
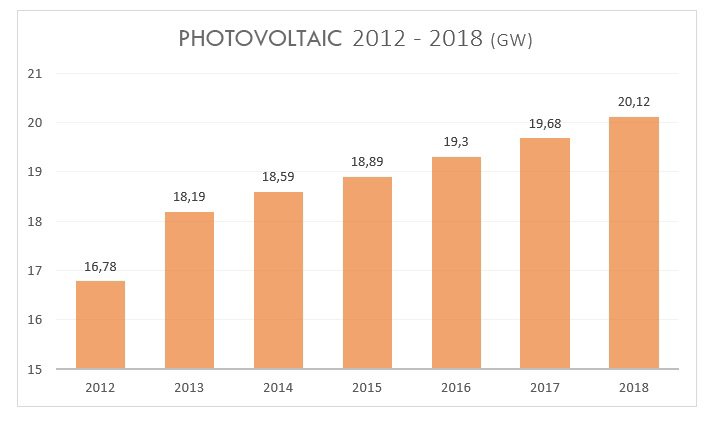
At December 31, 2018 in Italy were installed 20,117GW of photovoltaic power. It is true that plants were added for 434.7 MW, compared to 19.682.3 MW accumulated at the end of 2017 (see graph, source Terna), but this growth may be due to the impulse of the news already known on the FER1 Decree, then in process.
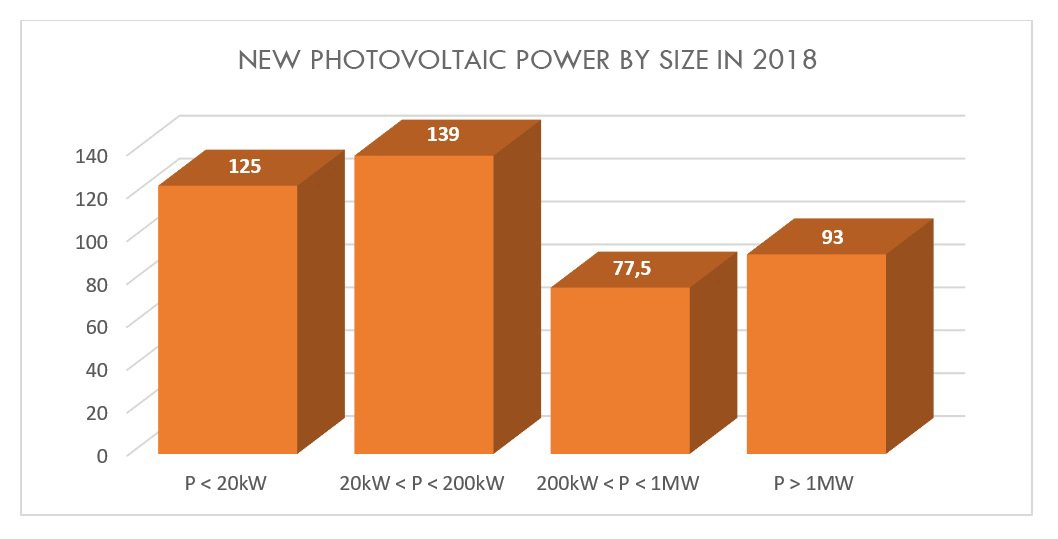
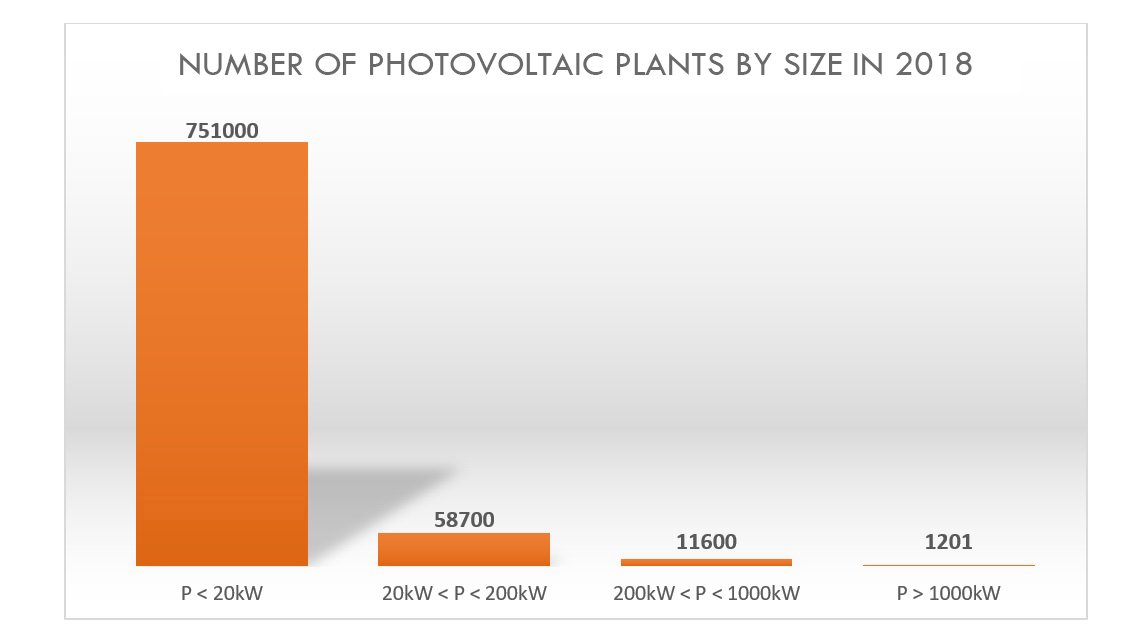
With regard to the different powers, in 2018 434.5 MW of photovoltaic systems were installed, distributed as follows:
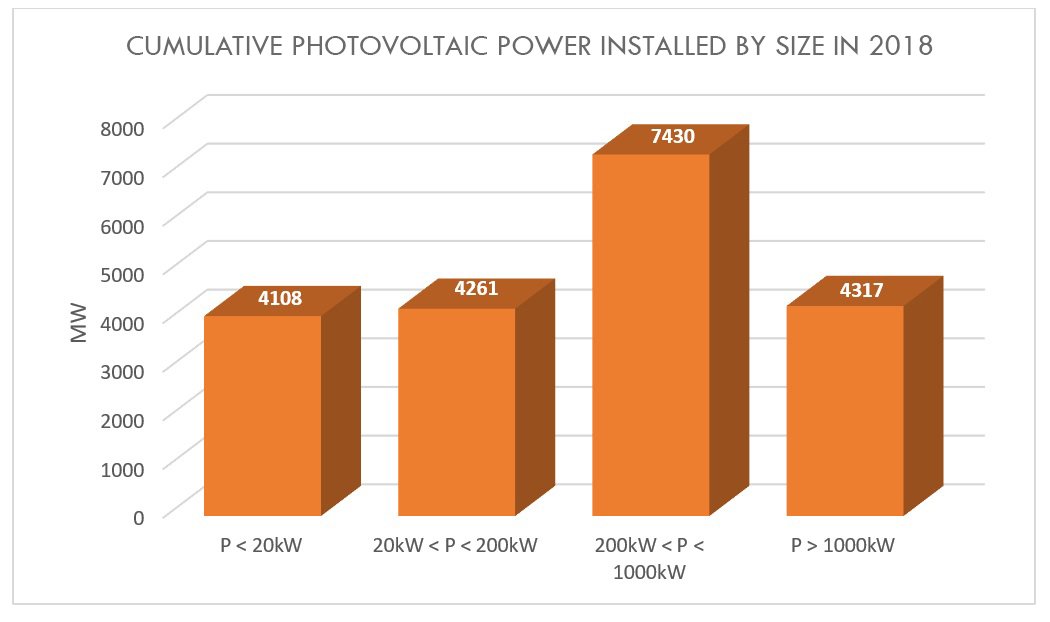
So far we have:
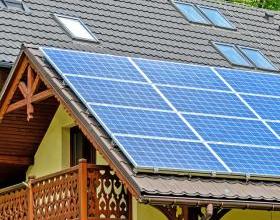
4,108 MW of cumulative power in the sizes below 20 kW, meaning about 751 thousand residential plants;
4,261 MW in about 58,700 systems between 20 and 200 kW;
7,430 MW in 11,600 installations between 200 kW and MW;
over 4.3 GW in 1,201 parks and systems above the MW.
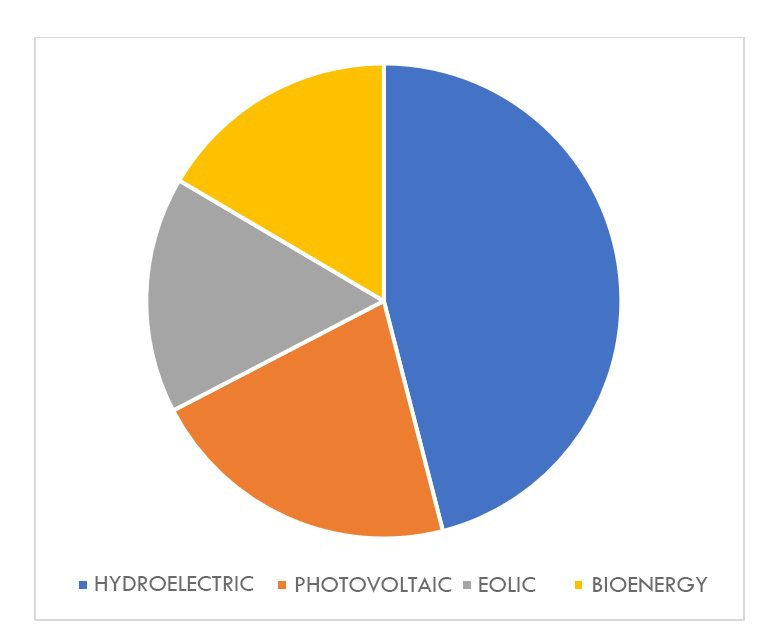
In 2018, the percentage of hydroelectric power over a total generation from renewables was 43.7% (graph on the right). Photovoltaics followed (20.3% against 23.4% in 2017), bioenergy (15.7%) and wind power (15.3% against 17.1% in 2017). Despite this, photovoltaics produced 22,887 GWh, covering 7.1% of electricity demand; scarcely less than in 2017, when it had supplied 24,017 GWh and 7.5% of consumption.
At the end of 2017, it showed the Manager's report (pdf), 774,014 photovoltaic systems were installed in Italy; most of these (about 92%) with power less than 20 kW, ie residential systems.
Given the substantial stability of total consumption, underlines the Manager, this trend is mainly linked to favorable weather conditions in 2017, such as the good irradiation that allowed to record the historical record in photovoltaic production (24.4 TWh, +10.3 % compared to 2016). However, in the electricity sector, the 787,000 plants operating in Italy, for an installed capacity of over 53 GW, generated 104 TWh of renewable energy, which covered 35% of the total gross production. Where hydroelectric is confirmed as the main source of electricity generation from RES, while the solar source is the one that recorded the most significant growth in the year.
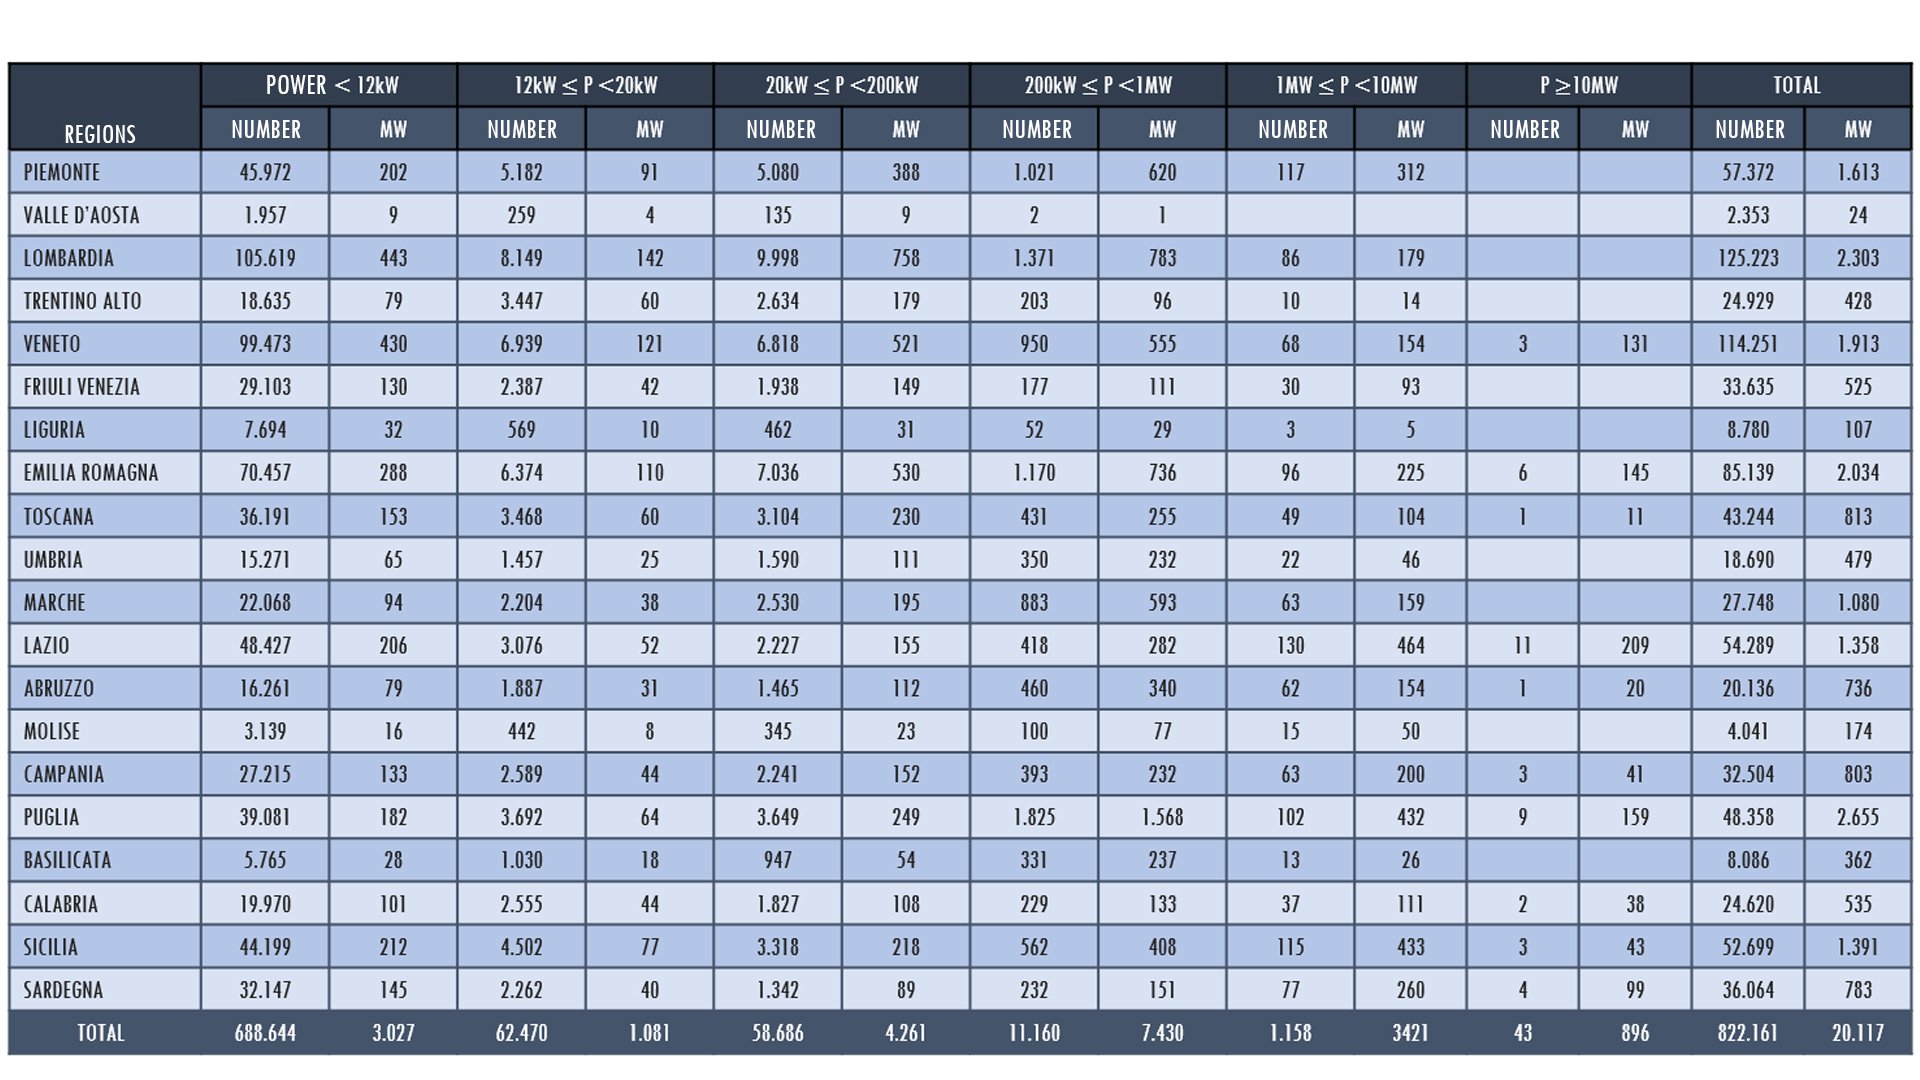
This is what emerges from the data supplied by Terna and elaborated by QualEnergia.it (table below), thus integrating the photography provided by the GSE, very detailed, but updated at the end of 2017.
Although renewable energies in Italy represent more than 18.3% of total energy consumption in Italy, there is still work to be done in relation to the socialization of the benefits and benefits of renewable sources.